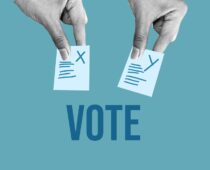


Earlier this year, the Boulder Police Department released data on its stops and use of force practices by race, but the picture it paints is incomplete.

The dashboard released by the Boulder PD includes reports on use-of-force-by-race and stops-by-race starting in 2024, with annual overviews shown for the years 2021 to 2023. This limited data does not compare to the in-depth information dashboards released by other Colorado police departments, and it does not reflect the thorough data sets that advocacy groups have been asking the city to share.
“We are committed to being more transparent, and as part of that transparency, we are working diligently to find additional ways to share data with our community,” Boulder PD Chief Stephen Redfearn and Chief Data Analyst Dr. Daniel Reinhard said in an email to Yellow Scene Magazine. “Due to requests from the community, we now have 13 dashboards, including the new use of force and contacts dashboards.”
The dashboard shows that use-of-force was used 266 times in 2024, which was down from 320 instances in 2023. In 2021, use-of-force was used in 239 cases. In 2024, 84% of subjects in use-of-force instances were white, compared to 11% who were Black.
Redfearn and Reinhard say earlier data isn’t available because of changes in the police department’s technology systems.
“Police department technology is constantly evolving. 2024 is the first complete year of our adoption of an improved records management system that we are using to update this dashboard,” they said.

According to Dan Williams of Boulder Progressives, the lack of complete and consistent data from prior years prevents meaningful analysis of use-of-force trends.
“Boulder did a pretty comprehensive study in 2018 of police stops by race, and then committed to doing a better job, and didn’t publish any data,” he said.
When the city was asked to release data again in 2021, the information didn’t align with the 2018 study, making it impossible to compare the two years.
“What they said at that time was that the city had just implemented new training on de-escalation techniques, and even though it looked like the city police were using force quite a bit against people, the number should get better over time,” Williams said. “They never updated the data, until this most recent data release earlier this year. There was no way to tell if what the police department was saying was accurate or inaccurate, whether this training was effective or ineffective.”
Still, Williams noted that some patterns are clear despite the gaps.
“Use of force, in general, has increased in Boulder since this training was implemented,” Williams said. “It would be helpful to have the police department explain why that is. Was the training that they chose ineffective, or were officers not following it? What happened?”
The dashboard left the Boulder Progressives with more questions than answers.
“Why are ten percent of the use-of-force incidents in Boulder against Black people, when Black people make up one percent of the city’s population?” Williams shared. “Those are questions that the police department should explain. By producing this data in ways that don’t match their prior data releases, they make it hard to hold them to account. There’s no real way to say definitively what the trends are here.”
Redfearn and Reinhard shared that many factors contribute to the use-of-force data, but denied that police training played a role.
“Over the past five years, there have been increases in suspects resisting arrest and obstructing police operations, assaults against first responders, and calls for police service to address criminal circumstances,” they told Yellow Scene.
Many argue that compared to departments in nearby cities, Boulder’s data offerings fall short.
 The Denver Police Department, for example, released a report detailing use-of-force incidents from 2019 to 2022. The report includes variables like the subject’s race, the officer’s race, and the level of force used. Aurora Police Department also maintains an interactive dashboard covering incidents from 2020 through 2024, with updates already available for 2025. Their data includes the race of both officer and subject, as well as the type of call involved. This kind of accessible, comprehensive dataset is what Boulder Progressives say they’d like to see from Boulder PD.
The Boulder Police Department says it’s hearing the criticism loud and clear and responding accordingly.
“We have had great feedback from the community and have made changes to the dashboards based upon community feedback,” Redfearn and Reinhard said. “We appreciate the input of our police oversight panel and other groups that have helped us improve the dashboards.”
The department has another kind of dashboard in the works that will display the feedback the police department receives, though no exact timeline for release has been confirmed.
Advocates say meaningful reform starts with meaningful data. Without consistent, detailed reporting on use-of-force incidents, it’s difficult for the public to hold police accountable or to measure whether changes are working. Updating the dashboard to include comprehensive demographic information would be a step toward the transparency Boulder officials have promised.